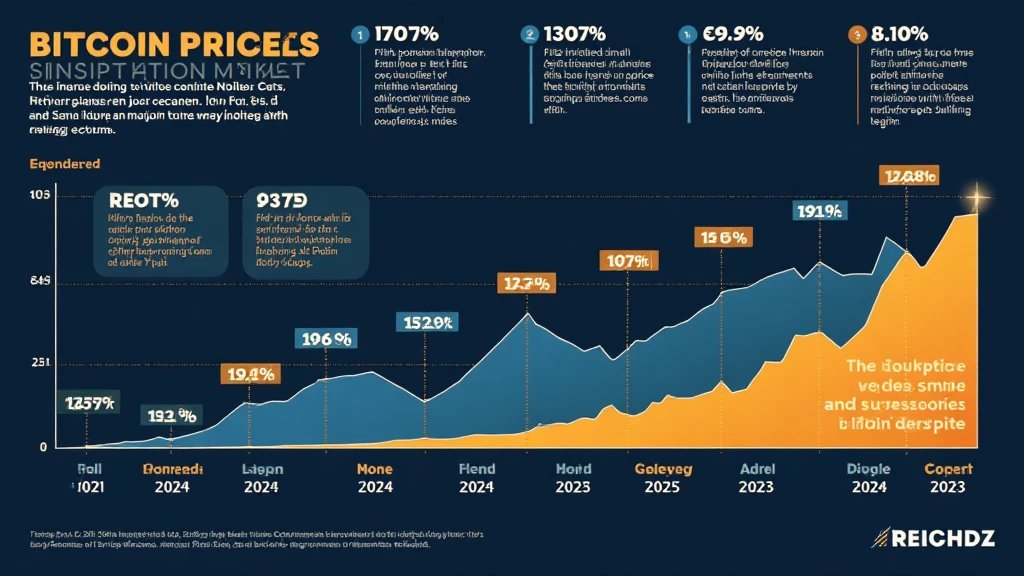
Bitcoin Price Historical Data: Understanding Trends and Insights
Introduction
Imagine losing $4.1B due to DeFi hacks in just one year—this staggering statistic highlights the importance of security in the crypto space, especially for Bitcoin. Investors continually seek reliable historical data to make informed decisions in this volatile market. This article delves into Bitcoin price historical data, revealing trends that can guide your future investments.
The Evolution of Bitcoin Pricing
Bitcoin was created in 2009 with a then-unknown price. Understanding its journey from a few cents to its peak can provide insights into future performance.
- 2009-2013: Bitcoin traded below $100, with early adopters considering it a novelty.
- 2014-2017: Prices began to rise significantly, peaking near $20K in late 2017.
- 2018-2020: A bear market followed with prices dropping to around $3.2K.
- 2021: Bitcoin rebounded, setting new all-time highs, surpassing $60K.
- 2022-present: Fluctuations continue, but adoption and institutional investment remain strong.
Why Historical Data Matters
Understanding Bitcoin price historical data serves two vital functions:

- Market Trends: Recognizing patterns can help investors understand potential future prices.
- Risk Management: Data enables more informed decisions on investment strategies.
Analyzing Bitcoin Price Trends
To effectively analyze Bitcoin prices over the years, several indicators should be reviewed:
- Moving Averages: This indicator smooths out price data to identify trends over time. For instance, the 50-day and 200-day moving averages are foundational in analyzing Bitcoin’s trajectory.
- Market Sentiment: News and events heavily affect Bitcoin prices. Understanding how public perception shifts can provide context for price changes.
- Supply and Demand: Bitcoin’s limited supply means that increased demand often leads to price surges—consider the impact of major institutions adopting Bitcoin.
Bitcoin Historical Price Table
| Year | Price at Start | Price at End | Annual Growth (%) |
|---|---|---|---|
| 2017 | $1,000 | $13,880 | 1,288% |
| 2018 | $13,880 | $3,800 | -72.6% |
| 2019 | $3,800 | $7,200 | 89.5% |
| 2020 | $7,200 | $28,900 | 302.8% |
| 2021 | $28,900 | $47,300 | 64.2% |
Data Source: CoinMarketCap
Tools for Analyzing Historical Data
Several tools can assist in analyzing Bitcoin price historical data effectively:
- TradingView: Excellent for technical analysis.
- CoinMarketCap: Great for comprehensive market analysis.
- CryptoQuant: Niche platform focused on on-chain data insights.
Emerging Trends in 2025
Looking ahead, Bitcoin adoption is on the rise. According to Vietnam’s growing cryptocurrency user base of 8%, trends may influence Bitcoin prices:
- Increased Institutional Investment: As organizations begin to allocate funds towards Bitcoin, demand could surge.
- Technological Advancements: More efficient transaction methods could alter how Bitcoin is perceived.
Conclusion
To sum it up, understanding Bitcoin price historical data is critical for anyone looking to invest or partake in the cryptocurrency space. By analyzing past trends, employing robust tools, and preparing for emerging patterns, you can make informed choices that align with market movements. Always remember, if you’re diving into these waters, consider local regulations and consult professionals where needed.
To keep track of cryptocurrencies and delve deeper into their intricacies, visit coinsvaluechecker, your reliable platform for currency insights.
Expert Author: Dr. Nguyen Tu
With a Ph.D. in blockchain technology, Dr. Nguyen has published over 25 papers in the field and has led audits for top-tier cryptocurrency projects.


