Understanding Bitcoin Price Chart Patterns
Understanding Bitcoin Price Chart Patterns
As Bitcoin continues to capture the attention of investors and traders alike, one of the most compelling aspects of this digital currency is its price chart patterns. In 2024 alone, the global trading volume for Bitcoin surpassed $1 trillion, emphasizing the need for a deeper understanding of these patterns.
For many, the journey into cryptocurrency begins with the hope of capitalizing on price fluctuations. However, many newcomers often overlook the significance of chart patterns in predicting market movements. This article aims to shed light on the nuances of Bitcoin price chart patterns, offering insights that can contribute to your trading success.
The Basics of Bitcoin Price Chart Patterns
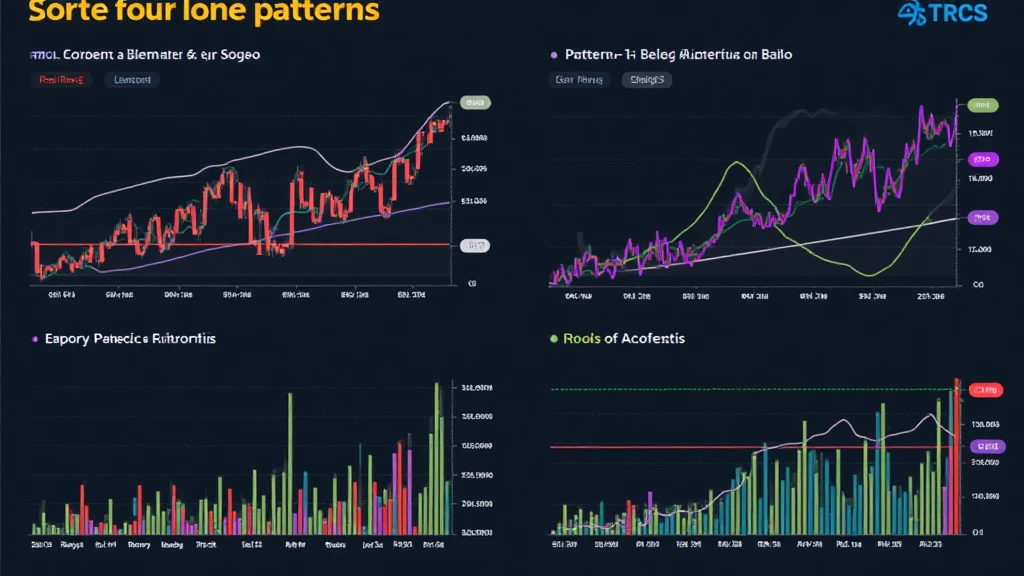
Price chart patterns are formations created by price movements over time. Understanding these shapes is crucial as they can signify future price movements. The primary aim of analyzing these patterns is to predict potential upward or downward trends in Bitcoin pricing.

Common Bitcoin Price Chart Patterns
- Head and Shoulders: This pattern often indicates a reversal trend, where the price peaks (the head) between two smaller peaks (the shoulders).
- Double Tops and Bottoms: These patterns signal potential reversals where the price hits a peak (or trough) twice before changing direction.
- Flags and Pennants: These short-term continuation patterns indicate that the price is likely to continue in the current direction after a brief consolidation.
Why Do Price Chart Patterns Matter?
Understanding Bitcoin price chart patterns is essential for several reasons:
- Informed Trading Decisions: Recognizing patterns can help traders make educated guesses about future price movements.
- Risk Management: These patterns can aid in setting stop-loss orders effectively, limiting potential losses.
- Market Psychology: Chart patterns reflect market sentiment, giving insight into the collective psychology of traders.
Analyzing Patterns with Technical Indicators
While chart patterns are vital, supplementing your analysis with technical indicators can enhance your trading strategy. Indicators like moving averages, Relative Strength Index (RSI), and Bollinger Bands can provide additional layers of analysis.
Implementing Technical Indicators
- Moving Averages: Smoothens price data to identify trends over specific periods, making it easier to spot potential reversals.
- RSI: A momentum oscillator that measures the speed and change of price movements, helping traders identify overbought or oversold conditions.
- Bollinger Bands: These bands can indicate volatility and potential price breakouts when the price moves outside the bands.
Bitcoin’s Performance and Market Context
In recent years, Bitcoin has demonstrated significant volatility, with its price experiencing rapid fluctuations. For instance, as reported by CoinMarketCap, Bitcoin’s price surged from under $10,000 in early 2020 to an all-time high of $69,000 in 2021 before correcting significantly.
Understanding how market sentiment impacts Bitcoin price is crucial. Factors like regulatory news, macroeconomic conditions, and technological advancements all play a role in shaping price movements.
Vietnam’s Growing Interest in Bitcoin
As the cryptocurrency market evolves, Vietnam emerges as a notable player, showing a 300% growth in Bitcoin users in 2023. This surge indicates a growing interest in cryptocurrencies among Vietnamese investors, highlighting the importance of understanding price chart patterns in this region.
Practical Strategies for Using Chart Patterns
Employing the knowledge of Bitcoin price chart patterns effectively requires a strategic approach:
- Stage Your Entry: Wait for a pattern to finalize before entering a trade to confirm its validity.
- Follow Market News: Always consider external factors that could disrupt the established pattern.
- Paper Trade First: Before risking real money, practice trading by simulating scenarios based on recognized patterns.
Conclusion: Mastering Bitcoin Price Chart Patterns
In the ever-evolving landscape of cryptocurrency, mastering Bitcoin price chart patterns can provide a distinct advantage for traders. Just like a seasoned sailor navigates through changing tides, understanding these patterns equips traders with the tools necessary to anticipate market movements.
As you delve deeper into Bitcoin trading, remember that consistency, research, and awareness of market dynamics are key to leveraging price chart patterns effectively. Stay informed, practice diligently, and you can navigate the fascinating world of Bitcoin trading with confidence and skill.
For more resources and insights, visit coinsvaluechecker.


