
How to Read Bitcoin Charts: A Complete Guide

How to Read Bitcoin Charts: A Complete Guide
With Bitcoin’s volatility, understanding how to read Bitcoin charts becomes vital for traders and investors alike. In 2024 alone, over $4 billion was lost to crypto hacks, making informed trading decisions more crucial than ever. This comprehensive guide will explore various aspects of Bitcoin charts, helping you grasp essential concepts and strategies.
Understanding the Basics of Bitcoin Charts
To kick things off, let’s break down what a Bitcoin chart is. Bitcoin charts display the price movements of Bitcoin over various timeframes. Whether you’re a seasoned trader or just dipping your toes into the world of cryptocurrency, knowing how to interpret these charts can significantly influence your trading success.
- Types of Charts: The most commonly used charts include line charts, candlestick charts, and bar charts.
- Timeframes: Different timeframes can show different trends – from 1 minute to 1 month.
- Price Movements: Observing price trends and patterns is key to predicting future movements.
1. Types of Bitcoin Charts
The three main types of Bitcoin charts are:
- Line Charts: These charts provide a straightforward view of Bitcoin’s price movements over time, connecting closing prices over a specified period.
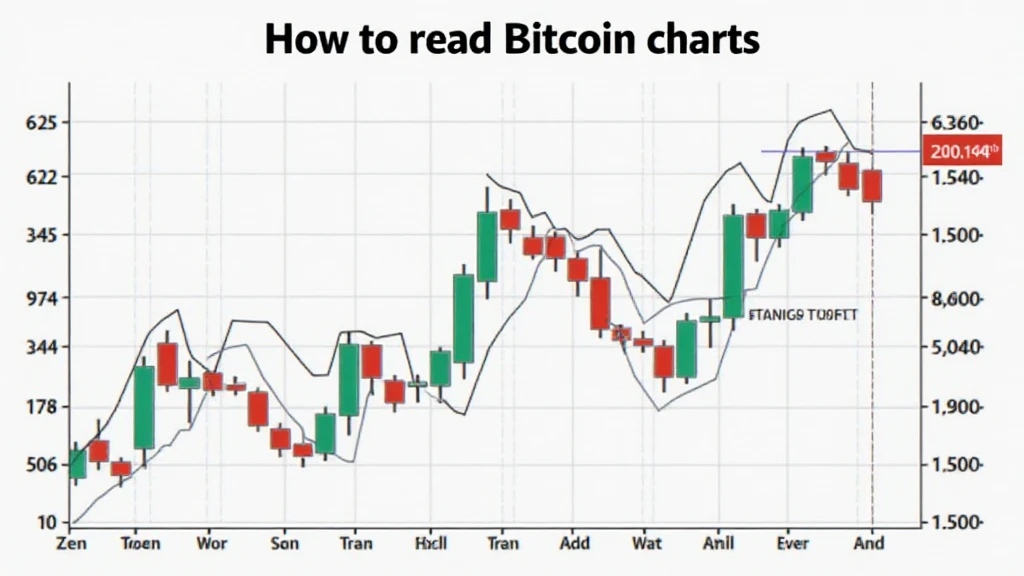
- Candlestick Charts: A popular choice among traders, candlestick charts illustrate the open, high, low, and closing prices for specific time periods, offering more information than line charts.
- Bar Charts: Similar to candlestick charts but use bars to represent the same price points.
2. Timeframes and Their Importance
Timeframes are essential in Bitcoin chart analysis. Here are some common ones:
- Short-term (1 minute to 1 hour): Useful for day traders who need to make quick decisions.
- Medium-term (1 day to 1 week): Helps swing traders to capture movements within a week.
- Long-term (1 month and above): Long-term investors may focus on broader trends.
3. Key Indicators to Look For
Chart indicators play a vital role in Bitcoin trading:
- Moving Averages: Indicators that smooth out price data to identify trends over a specific period.
- Volume: Indicates the quantity of Bitcoin traded, often acts as confirmation of price movements.
- Relative Strength Index (RSI): A momentum oscillator used to identify overbought or oversold conditions.
Reading Bitcoin Charts: Practical Steps
Now that we have a basic understanding, let’s dive into practical ways to read Bitcoin charts effectively.
1. Analyzing Price Trends
Price trends can be either upward (bullish), downward (bearish), or sideways (consolidation). Here’s how to analyze them:
- Identify the Trend: Look at the chart over different timeframes.
- Look for Support and Resistance Levels: Support levels indicate where prices tend to stop falling, while resistance levels are where prices stop rising.
2. Recognizing Chart Patterns
Chart patterns can give clues about future price movements. Common patterns include:
- Head and Shoulders: Often signals a reversal.
- Double Tops and Bottoms: Indicators of potential turnarounds.
- Triangular Patterns: Signify periods of consolidation before a breakout.
3. Using Technical Analysis Tools
Many tools can assist you in analyzing Bitcoin charts:
- TradingView: A powerful platform offering a plethora of analysis tools and community insights.
- CoinMarketCap: Provides historical price data and market cap statistics.
- Binance: Offers integrated chart analysis tools to make trading easier.
Understanding Market Sentiment
Market sentiment is crucial to comprehend your Bitcoin chart reading. Public perception can significantly affect market trends. Tools and resources such as social media platforms, news outlets, and crypto forums can lend insight into prevailing market sentiment.
- Fear and Greed Index: Offers a gauge of market emotions and can influence trading decisions.
- News Events: Major news can sway public sentiment, leading to price volatility.
Local Insights: The Growing Vietnamese Crypto Market
Vietnam has seen a growing interest in Bitcoin and cryptocurrency over the past few years. According to recent data, Vietnam’s cryptocurrency users have grown by an astonishing 50% in the last year. This surge reflects a vibrant market where traders, including newcomers, can learn and apply chart reading techniques effectively.
Furthermore, the Vietnamese government is slowly beginning to embrace blockchain technology, which means more resources and educational materials will likely become available to help local users navigate the crypto landscape.
Advanced Chart Reading Techniques
For those looking to take their chart reading skills to the next level, consider these advanced techniques:
- Fibonacci Retracement: A popular tool for identifying potential reversal levels.
- Volume Profile: Analyzes trading volume over a specified time period to identify significant price levels.
- Order Flow Analysis: Studies the dynamics between buyers and sellers to predict market movement.
Conclusion: Mastering Bitcoin Chart Reading
Learning how to read Bitcoin charts is essential for anyone looking to navigate the volatile waters of cryptocurrency trading. Whether you’re utilizing basic concepts or advanced strategies, the key to successful trading is practice and continuous learning.
As the cryptocurrency landscape continues to evolve, so does the importance of proper chart analysis. Always stay updated and adapt your strategies accordingly. For more insights, visit hibt.com and enhance your understanding of Bitcoin trading.
By mastering Bitcoin chart reading, you’re not just improving your trading skills; you’re building a foundation for making informed and strategic investment decisions in the ever-changing crypto market. Happy trading!
