
Understanding Bitcoin Halving Technical Indicators

Understanding Bitcoin Halving Technical Indicators
With crypto markets evolving rapidly, a notable event on every investor’s radar is the Bitcoin halving. In fact, over the past decade, Bitcoin has undergone several halving events, significantly influencing market prices. According to recent research from Chainalysis in 2025, these halving events often lead to increased speculation and volatility among investors.
What is Bitcoin Halving?
Before diving into the technical indicators, let’s clarify what Bitcoin halving entails. Essentially, halving refers to the event that occurs approximately every four years, or after every 210,000 blocks mined. During this event, the reward for mining new blocks is cut in half, which creates a scarcity effect for Bitcoin. This mechanism is pivotal in maintaining Bitcoin’s supply cap of 21 million coins.
Historical Context of Bitcoin Halving
Every halving impacts Bitcoin’s economic model and market perception. The previous halving events occurred in:
- 2012 – Reward decreased from 50 BTC to 25 BTC
- 2016 – Reward decreased from 25 BTC to 12.5 BTC
- 2020 – Reward decreased from 12.5 BTC to 6.25 BTC
Looking at the price trends post-halving, data indicates a significant uptrend; however, it’s crucial to examine the technical indicators that contributed to these shifts.
Technical Indicators to Watch
In the lead-up to a halving event, certain technical indicators can offer insights into potential market movements.
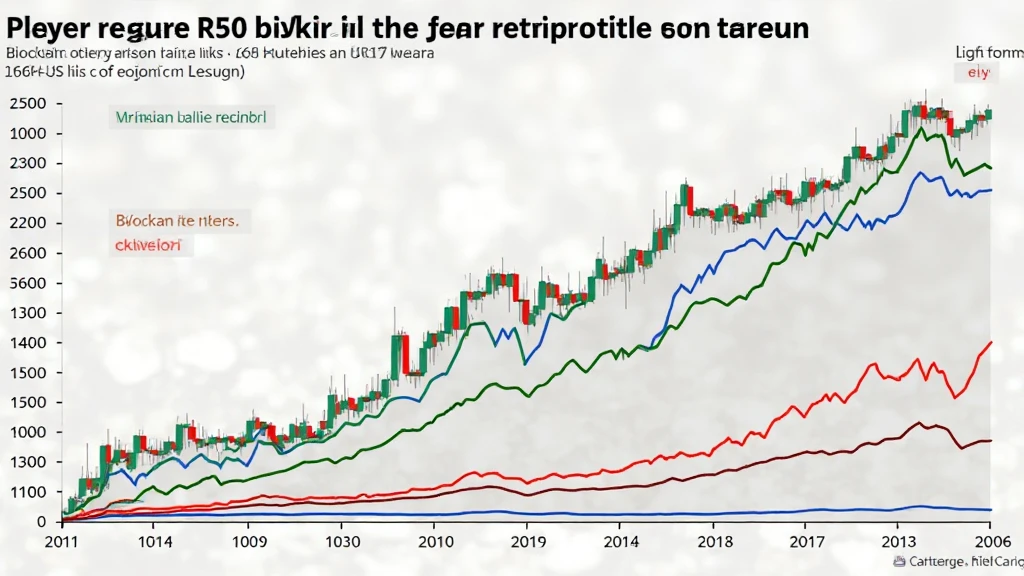
1. Moving Averages
Moving averages, particularly the 50-day and 200-day moving averages, are critical for assessing overall market trends. A golden cross, where the short-term moving average crosses above the long-term average, often signals bullish sentiment among traders.
2. Relative Strength Index (RSI)
The RSI measures the speed and change of price movements, providing insights into overbought or oversold conditions. An RSI over 70 may indicate that Bitcoin is overbought, which could precede a price correction, while an RSI below 30 may indicate overselling, suggesting a potential buying opportunity.
3. Volume Trends
Analyzing trading volume provides a clearer picture of market interest. A spike in trading volume often precedes significant price movements, typically aligned with halving events.
Market Sentiment Analysis
Sentiment in trading is often driven by social media, news coverage, and public discourse surrounding Bitcoin. For instance, in Vietnam, as the crypto community grows, increasing public interest is reflected in social media platforms. The Vietnam users growth rate has surged by 45% in the past year, contributing to heightened sentiment leading up to the halving.
Using Technical Indicators for Strategic Decisions
Investors should utilize these indicators as part of a more comprehensive strategy rather than relying solely on them. Here’s how to integrate technical analysis into your investment plan:
- Combining Indicators – Utilize multiple indicators to confirm trends. For example, a moving average crossover could be more compelling if aligned with volume spikes.
- Setting Entry and Exit Points – Determine your strategy ahead of anticipated price movements, potentially using Fibonacci levels for support and resistance.
- Risk Management – Always implement a stop-loss strategy to limit potential losses, especially in volatile periods.
Future Outlook and Prediction Models
As we approach the next halving event scheduled for 2024, investors are eager to understand the potential implications on Bitcoin prices. Historical data suggests that past halvings have preceded unprecedented price surges. However, it’s essential to account for external factors, such as global economic conditions and regulatory changes that may impact market dynamics.
2025 Price Forecasts
Predictive models based on historical price movements post-halving suggest that Bitcoin could see significant gains by 2025. Analysts expect the price to potentially rise between $100,000 and $300,000 depending on market conditions and adoption rates.
Key Takeaways
Understanding Bitcoin halving and the associated technical indicators is vital for any crypto investor. By being aware of trading volume, market sentiment, and identifying critical crossover patterns, traders can make informed choices.
- Keep informed about upcoming halving dates and adjust your strategies accordingly.
- Incorporate a variety of indicators to strengthen trading decisions.
- Stay updated with market trends and community sentiments, especially in emerging markets like Vietnam.
These insights culminate in a comprehensive understanding of how to interpret Bitcoin halving technical indicators and assess their implications on future price movements. In a rapidly changing world of digital currencies, effective strategies can serve as your compass.
For more insights on digital asset management, visit coinsvaluechecker.
Written by Nguyen Van An, an acclaimed cryptocurrency researcher with over 20 authoritative papers on blockchain technology and financial modeling, with expertise in auditing prominent crypto portfolios.

